Vibration monitoring is a flexible and robust method for detecting and diagnosing faults in moving machinery. It is critical for the analyst to have clear understanding of the vibration signal being analysed and the tools at their disposal. This post serves to explain the differences between stationary and non-stationary vibration signals and the tools available to analyse them.
1.1. Signal Classification
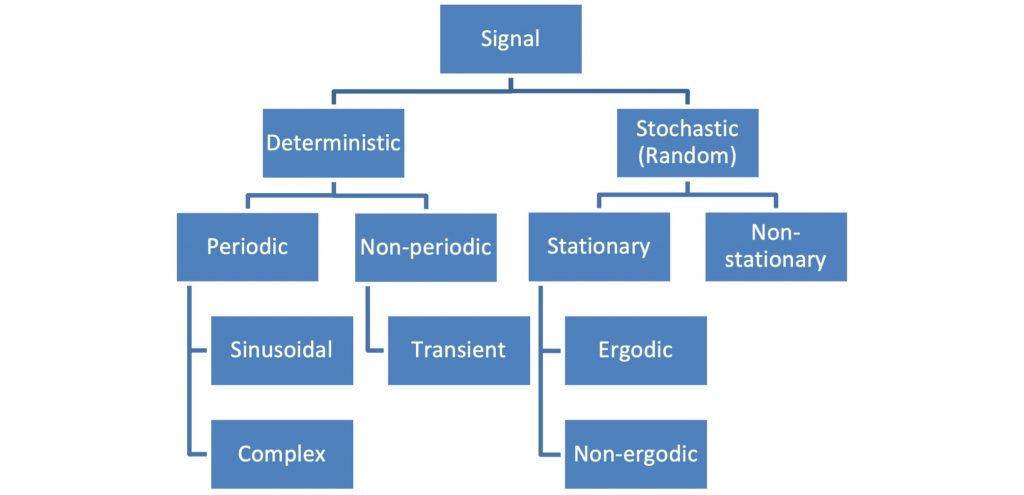
Most dynamic vibration signals can be classified using the tree diagram below. Most recorded vibration responses are regarded as stochastic due to the presence of random noise in the signal. Stationary signals are signals where the stochastic properties remain constant over time. Examples of equipment which produce stationary vibration responses are:
- Vibrating screen operating at constant speed.
- Grinding mills and scrubbers operating at constant speed.
- Gearboxes and motors operating at constant load and speed.
Examples of equipment which produce non-stationary vibration responses are:
- Vehicles driving over rough terrain.
- Start-up and shutdown of equipment.
- Equipment where speed and load fluctuate over time.

1.2. Signal analysis
Stationary vibration signals can be analysed using standard spectral analysis tools such as the Fast Fourier Transform (FFT) and the Power Spectral Density (PSD). Due to the time-dependent nature of non-stationary signals, these tools are not applicable. Hence, if a signal is incorrectly classified and the wrong tools is used, erroneous results will be produced.
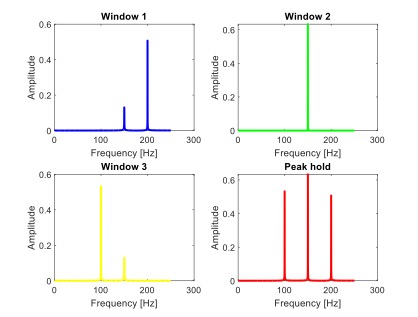
At Investmech, two tools are used to analyse non-stationary vibration signals namely, the peak hold approach and the waterfall approach. Both approaches divide the signal into windows of specified length and assume the signal within each window to be stationary thus allowing the standard spectral analysis tools to be used. The peak hold approach keeps the maximum value along the spectrum of all windows. The basic approach is illustrated in Figure 2. The signal with three dominant frequencies which vary with time was divided into three windows. The PSD of each window was computed and plotted, and it is displayed that each window can only detect two of the three frequencies. However, by implementing the peak hold approach the frequency and magnitude of all three dominant frequencies can be detected.

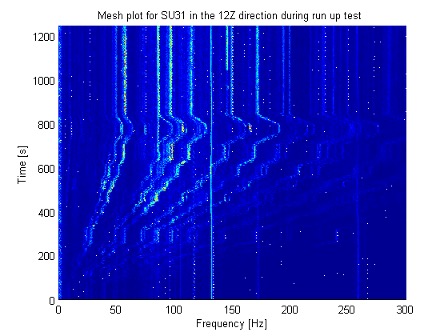
The waterfall method (also known as Short Time Fourier Transform or spectrogram) is generally a 3D representation of the spectrum over time. The spectrum of each window is presented in a waterfall or cascade plot. An example of a waterfall plot is given in Figure 3. The plot was generated from vibration measurements conducted on a paper mill during start up. It clearly illustrates the dominant frequencies increasing with time as the mill increases in speed up until it reaches its maximum operating speed.

1.3. Conclusion
In conclusion, it is critical that vibration analysts are able to accurately identify the signal they are evaluating and then select the suitable tools. Evaluating vibration signals with the incorrect tools can lead to misdetection of faults. There are many powerful tools for evaluating non-stationary vibration signals however, it is vital the analyst understands the tools and correctly implements them to ensure accurate results.


0 Comments